How ValueHunter’s User Brief Works: Watchlist News Summaries You Can Trust
Learn how ValueHunter enables you to stay up to date with the stocks you're interested in without missing a beat.
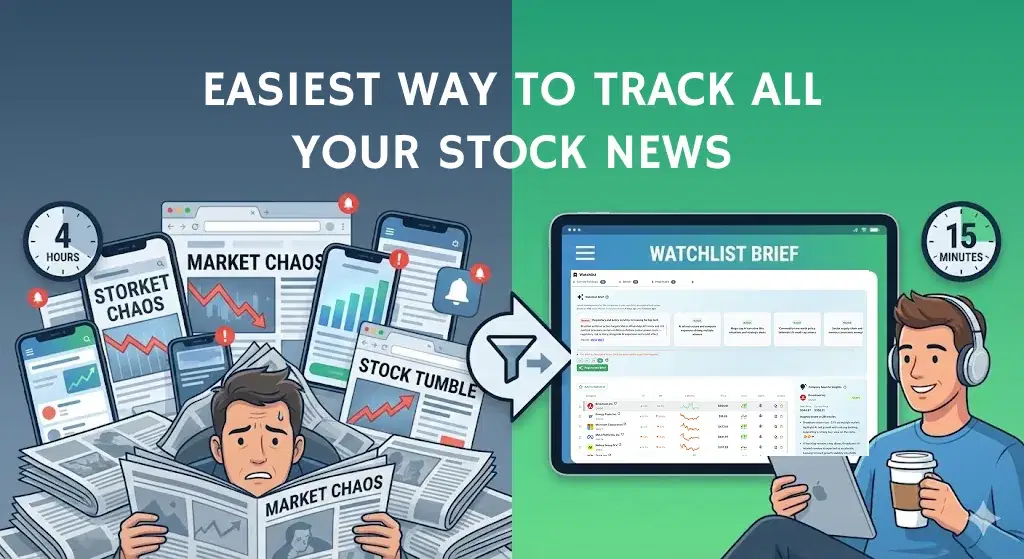
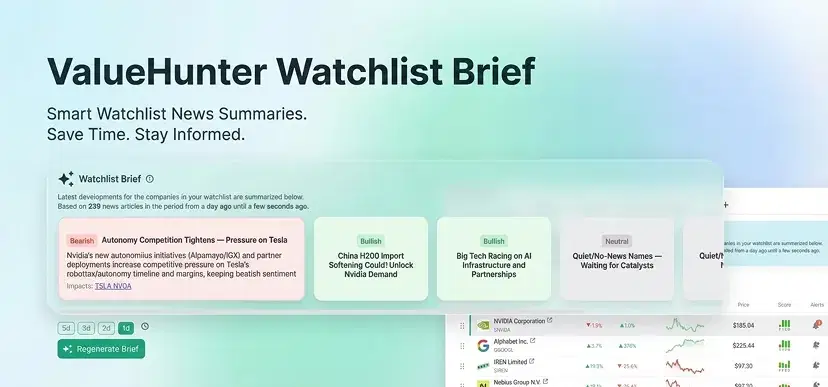
Watchlist Brief on ValueHunter: Stay Up to Date Without Reading Hundreds of Articles
The gist (TL;DR)
- What it is: Watchlist Brief is an insight-dense, AI summary of what happened to the stocks you are interested in over a specific time window.
- What problem it solves: You stop missing important news because you weren’t checking markets every hour.
- What you get: General watchlist insights (the big themes) + per-stock insights (what matters for each ticker).
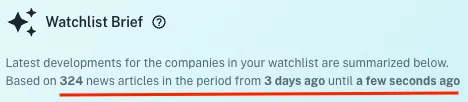
- What’s transparent: Every brief shows start date, end date, and how many news articles were used—plus references to the actual news articles.
- What’s flexible: You can keep multiple watchlists, generate multiple briefs, and regenerate past periods to see what changed (or what you missed).
Add stocks to your watchlist and try User Brief (click here)
The direct answer
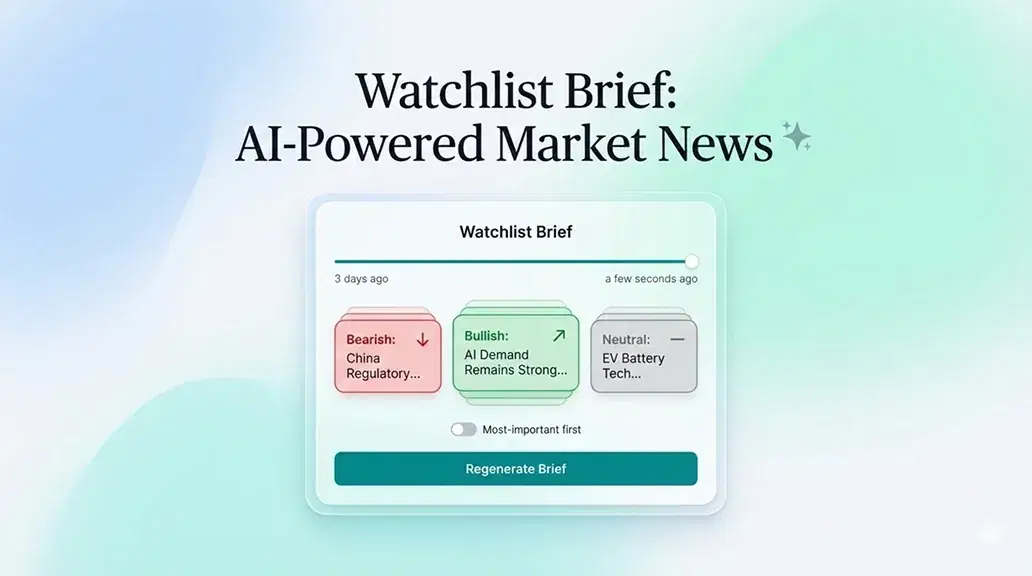
The Watchlist Brief feature turns a noisy stream of market news into a structured, time-bounded summary for your watchlist. It collects relevant news for each stock, groups the important events into short insights, labels the overall impact (bullish/bearish/neutral), and shows you exactly what time period and how many articles were used—so you can stay informed quickly and consistently, even if you log in irregularly.
Key terms
- Watchlist: A custom list of stocks you track (you can have multiple watchlists).
- Brief period (start → end): The exact time period the brief covers (shown in the UI).
- General watchlist insights: Themes that affect multiple stocks (or the watchlist as a whole).
- Per-stock insights: Stock-specific developments for each ticker in the watchlist.
Why investors need Watchlist Briefs
If you follow more than a handful of companies, your time gets eaten by three problems:
- News overload: Even one stock can have dozens of articles in a few days. Multiply that by 10–30 tickers and you’re done.
- Context switching: You skim headlines but miss what matters (earnings guidance, product delays, regulation, lawsuits, M&A rumors, supply chain issues).
- Gaps between logins: If you don’t check daily, you’re always catching up—and often late.
User Brief is built for that reality: it’s designed to help you log in, understand the meaningful developments since your last check, and move on.
What data goes into a Watchlist Brief
User Briefs are built from two types of information:
1) News articles per stock
For each ticker in your watchlist, ValueHunter collects relevant news published between the start and end date of the brief.
The brief informs you of the number of articles used. That’s your “coverage indicator.” If the brief says it used 12 articles, you know it’s summarizing a small set. If it used 280, you know it had a lot to sift through.
2) Time window (start date and end date)
Every brief is tied to a clear date range:
- Start date: typically your last login (with a “smart” cap so it doesn’t go too far back by default)
- End date: usually “now” (the time the brief was generated)
This is not cosmetic. It’s what makes the brief auditable. You always know what period the summary covers.
You’ll see the date range directly in the brief UI, alongside the article count.
Generate your first brief in seconds (click here)
How a Watchlist Brief is generated (step-by-step)
Step 1: You choose a watchlist (and optionally a start date)
You generate a brief from a watchlist. You can also choose a custom start date if you want to analyze a past period.
~~This is what enables workflows like:
- “What happened since I last logged in?”
- “Summarize the last 3 days.”
- “Regenerate for the week around earnings.”~~
Step 2: ValueHunter collects the relevant news for each ticker
For each stock in your watchlist, ValueHunter gathers the articles/news that were published only in that time window. ~~Then it creates a clean internal list where:
- every article gets an ID
- every insight can reference those IDs (so the insight isn’t “floating in the air”)~~
Step 3: Per-stock insights are created first
Each stock gets its own mini-summary—short, focused, and capped to a small number of insights (so it stays readable).
These insights are intentionally concise:
- they capture the main event(s)
- they add different angles when useful (example: “market reaction” vs “business fundamentals”)
- they link to the related articles
Step 4: General watchlist insights are created second
After per-stock insights exist, ValueHunter generates the “big picture” themes for the whole watchlist.
This is where you get items like:
- “Semiconductor demand narrative shifted… impacts NVDA/AMD/ASML”
- “Regulatory headlines hit multiple holdings… impacts X, Y, Z”
- “Earnings guidance tone improved across several holdings…”
Each general insight includes:
- a title
- a short explanation
- a bullish / bearish / neutral label
- impacted tickers (the stocks connected to that insight)
Step 5: Everything is assembled into one brief with transparent metadata
The final brief includes:
- total article count used
- the start/end date used
- general insights
- per-stock insights (including per-stock article counts)
General watchlist insights (big themes)
This section is meant to answer: “What’s the story across my watchlist?”
It’s especially useful when:
- multiple holdings are affected by the same macro theme
- sector news impacts several tickers
- you want to understand correlations and shared risks
What you’ll see in the General Overview section
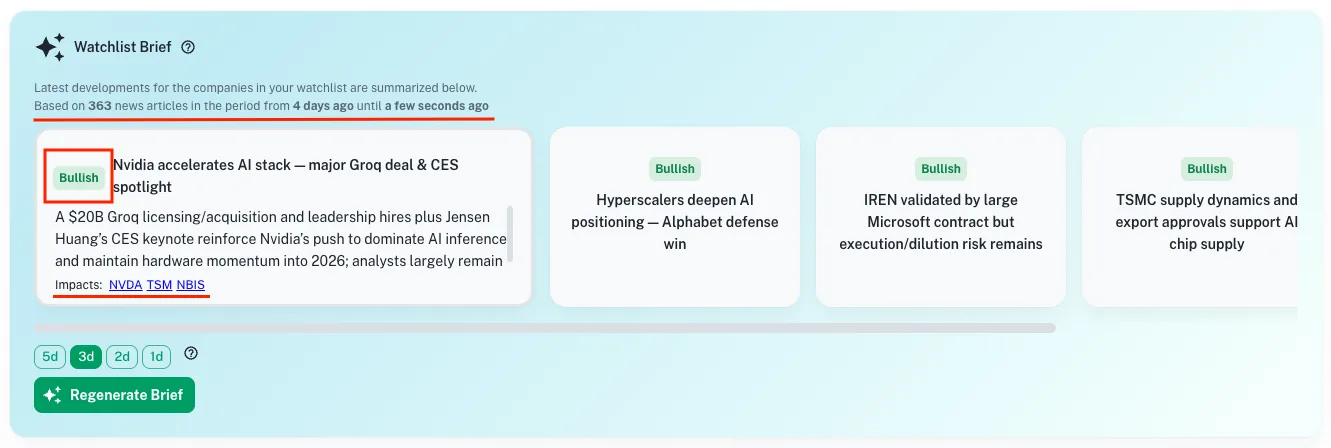
1) Bullish / bearish / neutral label (per insight) Each insight is tagged to help you scan quickly.
- Bullish: likely positive business or market implications
- Bearish: likely negative implications or increased risk
- Neutral: mixed, uncertain, or informational without a clear directional impact
This isn’t meant to replace your judgment. It’s a sorting and scanning tool.
2) Impacted tickers (so you see what the insight touches) Each insight lists the tickers it relates to, so you can jump directly from theme → affected stocks.
3) Expandable format (read headlines first, details second) The UI is designed for speed: see the title and label fast, expand only what matters.
4) Transparent coverage: “Based on X news articles” This is crucial. It tells you how much raw information the brief summarized for the time window.
See the screenshot below
See your watchlist’s big themes instantly (click here)
Per-stock insights (what matters for each ticker)
This section answers: “What happened to each company I care about?”
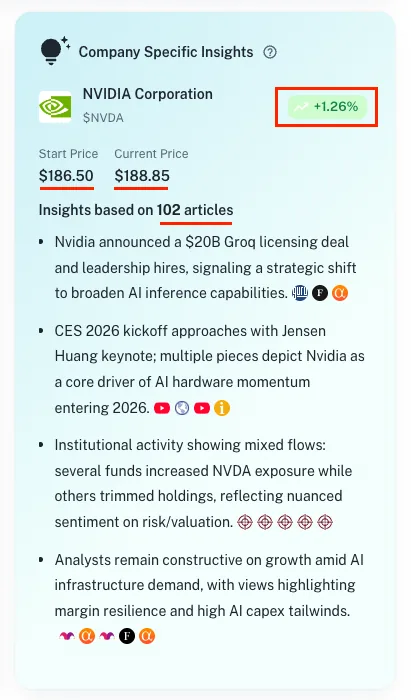
For every stock in the watchlist, ValueHunter shows a dedicated block with insights that are:
- specific to that ticker
- short (so you can scan)
- connected to the relevant articles behind the insight
What you’ll see for each stock
1) A small set of insights (not an endless feed)
The point is to highlight what mattered—not list everything.
2) News references for traceability Each insight contains references to the underlying articles (via the news mapping system).
This allows you to verify context for each insight and dig deeper when something looks important.
3) Per-stock article count You’ll see how many articles were considered for that stock in that period. This helps you interpret confidence:
- Low count can mean quiet period (or limited coverage)
- High count can mean a noisy period (where summarization matters most)
4) A consistent structure across tickers This matters more than it sounds. If every stock block is formatted the same way, your brain gets faster at scanning.
See the screenshot below
Regenerating briefs for different dates
Most tools show you “latest news.” That’s not enough.
With Watchlist Brief, you can regenerate for a chosen date range, which enables you to control the time window, and catch up quickly if you've missed a beat.
Multiple watchlists and multiple briefs
Investors rarely track everything in one bucket.
Watchlist Briefis designed for multiple workflows, just some examples:
- “Long-term compounders.”
- “High convictio.n”
- “Dividends”
- “Speculative / turnaround.”
- “Earnings this month.”
Each watchlist can have its own brief, which keeps your research organized and prevents the classic mess of mixing unrelated holdings.
A simple worked example (what it feels like in practice)
Imagine your watchlist has 12 stocks and you log in every 2–3 days.
You generate a brief and it shows:
- Based on 146 news articles
- From 2 days ago → Until now
In the General Overview you might see five themes:
- 2 bullish items (positive guidance, product momentum)
- 2 bearish items (regulatory pressure, margin concerns)
- 1 neutral item (industry report / management changes)
Each one shows impacted tickers like: “Impacts: AAPL, MSFT, GOOGL”.
Then you scroll to per-stock insights and for each ticker you see:
- 2–4 concise insights
- the number of articles for that stock (example: “News: 18 articles”)
- clickable references to the relevant news
Net result: you’re informed in minutes, and you still can verify and go deeper.
Methodology and limitations
Here’s what Watchlist Brief does and doesn’t do—so you don’t overtrust it.
What it does
- Summarizes relevant watchlist news inside a visible date window.
- Produces general themes + per-stock insights.
- Shows article counts and links insights to the related news sources.
- Labels general insights as bullish/bearish/neutral to improve scanning.
What it doesn’t do
- It’s not a guarantee that every important event is captured perfectly.
- Labels are not investment advice; they’re a quick classification.
- It doesn’t replace reading original sources for high-stakes decisions.
Treat it like a research accelerator: it reduces the surface area, then it is your responsibility to choose where to zoom in.
Common mistakes investors make with news (and how User Brief helps)
Mistake 1: Reading headlines only
Headlines can be misleading or incomplete. User Brief compresses the story into a coherent point, then lets you click into sources.
Mistake 2: Overreacting to one article
One article is noise. A brief built from many articles helps you see whether something is a one-off or a broader theme.
Mistake 3: Losing track of time windows
“Recent” is vague. User Brief makes the time window explicit (start and end date).
Mistake 4: Mixing watchlists mentally
When everything is in one stream, you blur strategies. Multiple watchlists + briefs keep your research clean.
FAQ
Is Watchlist Brief the same as “latest news”?
No. It’s a summary of a defined time window with general themes and per-stock insights, plus transparency about dates and article counts.
How often should I regenerate a brief?
If you log in daily, once a day is enough. If you log in every few days, generate it when you return so you get a clean catch-up.
Why do you show the number of articles used?
Because it’s your transparency signal. It tells you how much information the brief had to digest and gives context to the summary.
What does bullish/bearish/neutral mean here?
It’s a quick label for the likely direction of impact described by that general insight. It’s meant for scanning and prioritization, not as a trading signal.
Can I regenerate a brief for a past date range?
Yes. That’s a core feature: you can analyze what happened during a specific period, not only “now”.
Where to next?
Try the user brief now by clicking here) - It is completely free.
If you have any feedback, questions, or suggestions, I would love to hear them!