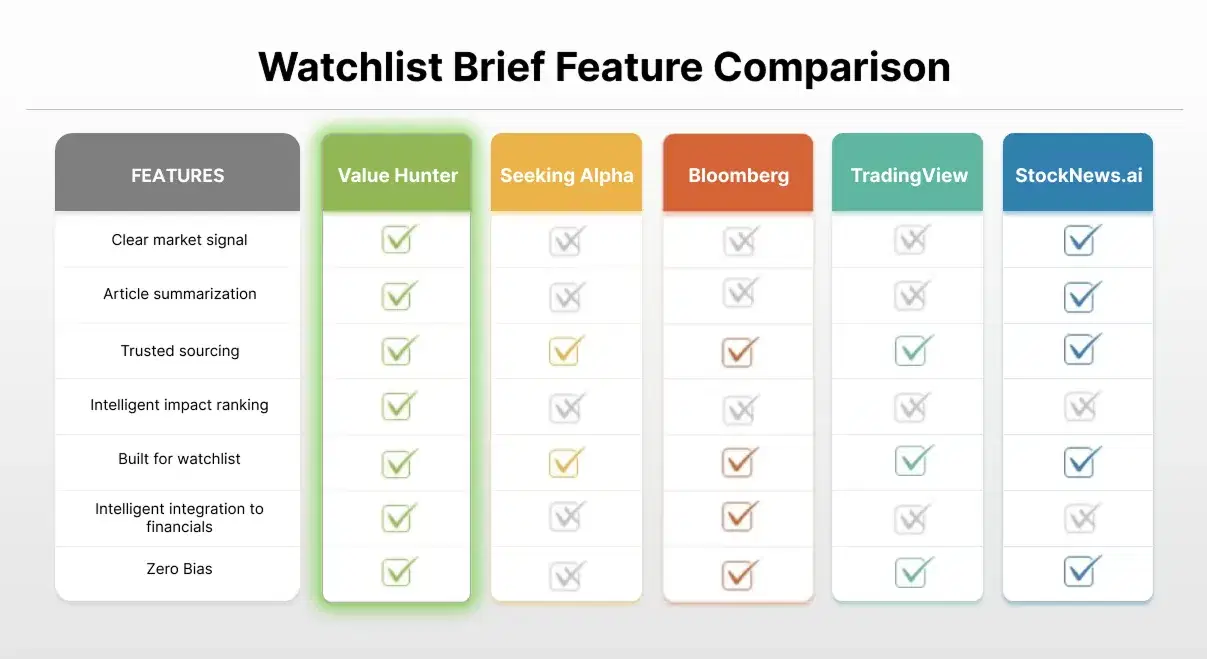
How Scoring Works
In this blog post we'll go through our scoring algorithm implementation
How does our scoring algorithm work?
Our algorithm is based on the principles of value investing and fundamental analysis. The algorithm tries to evaluate the attractiveness of a company based on various factors and by relying on fundamental metrics and ratios. It aims to find companies that are undervalued, have strong financials, are efficient, and have good growth potential.
1. Gather data
Every day, we gather the latest data for all companies traded on the NYSE, NASDAQ, and AMEX exchanges, totaling approximately 7,000 companies (we are working on adding other exchanges).
2. Overall score
Each company is evaluated based on four key components. Each component is rated on a 1-5 scale (5 being the best). The overall score for the company is the average of these four individual scores. The key components are:
- Valuation (Price Attractiveness)
- Financial Strength
- Efficiency
- Future Growth Potential

On the image above, the company has an almost perfect score of 4.6 for Valuation (indicates it might be undervalued) and a good score of 2.9 on Future Growth. The mean of all these 4 scores forms the overall score of 3.63.
3. Component scores
The score for each component (e.g., Valuation) is the average score of the ratios/metrics that comprise that component. The ratios used for each component are:
Valuation (Price Attractiveness)
- Price To Earnings
- Price To Book
- Price to Free Cash Flows
- Enterprise Value to EBITDA
- Price to Earnings Growth (PEG)
Financial Strength
- Current ratio
- Quick ratio
- Debt To Equity ratio
- Debt To Assets ratio
- Interest Coverage Ratio
- Piotroski F-Score
Efficiency
- Return On Capital Invested (ROCE)
- Return On Equity (ROE)
- Return On Assets (ROA)
- Gross Profit Margin
- Net Profit Margin
- Asset Turnover Ratio
Future Growth Potential
- Expected Revenue Growth (1 year)
- Expected EBITDA Growth (1 year)
- Expected EPS Growth (1 year)
- Past Revenue Growth (5 years)
- Past EBIDTA Growth (5 years)
- Past EPS Growth (5 years)
- Revenue Growth Consistency (5 years)
- EBITDA Growth Consistency (5 years)
- EPS Growth Consistency (5 years)
If a company has the following scores for each ratio:
- Price To Earnings: 4
- Price To Book: 3
- Price to Free Cashflows: 5
- Enterprise Value to EBITDA: 4
- Price to Earnings Growth (PEG): 3
The score for Valuation will be the average of these scores: (4 + 3 + 5 + 4 + 3) / 5 = 3.8
Range Scoring
A score to each ratio is assigned based on what range it falls into. For example, a Price To Earnings Ratio of 10 or lower will get a max score of 5, if P/E is between 10 and 15 it will get a score of 4, and so on. Similar for other ratios like Price To Book, Current Ratio, and so on.
Industry matters
The scoring is sector-specific. Each sector has its own scoring range for each ratio. For example, a Price To Book ratio of 1.5 or lower will get a max score of 5 for a company in the Basic Materials sector, while a company in the Technology sector will get a max score of 5 if P/B is 3 or lower.
This is because different sectors have varying typical ratios based on the nature of their businesses.
Growth (a special case)
When scoring growth, the past and expected (future) growth rates are considered. For example, a company that has grown its revenue by 20% per year for the past 5 years will get a higher score than a company that has grown its revenue by 10% per year. Similar for expected growth rates.
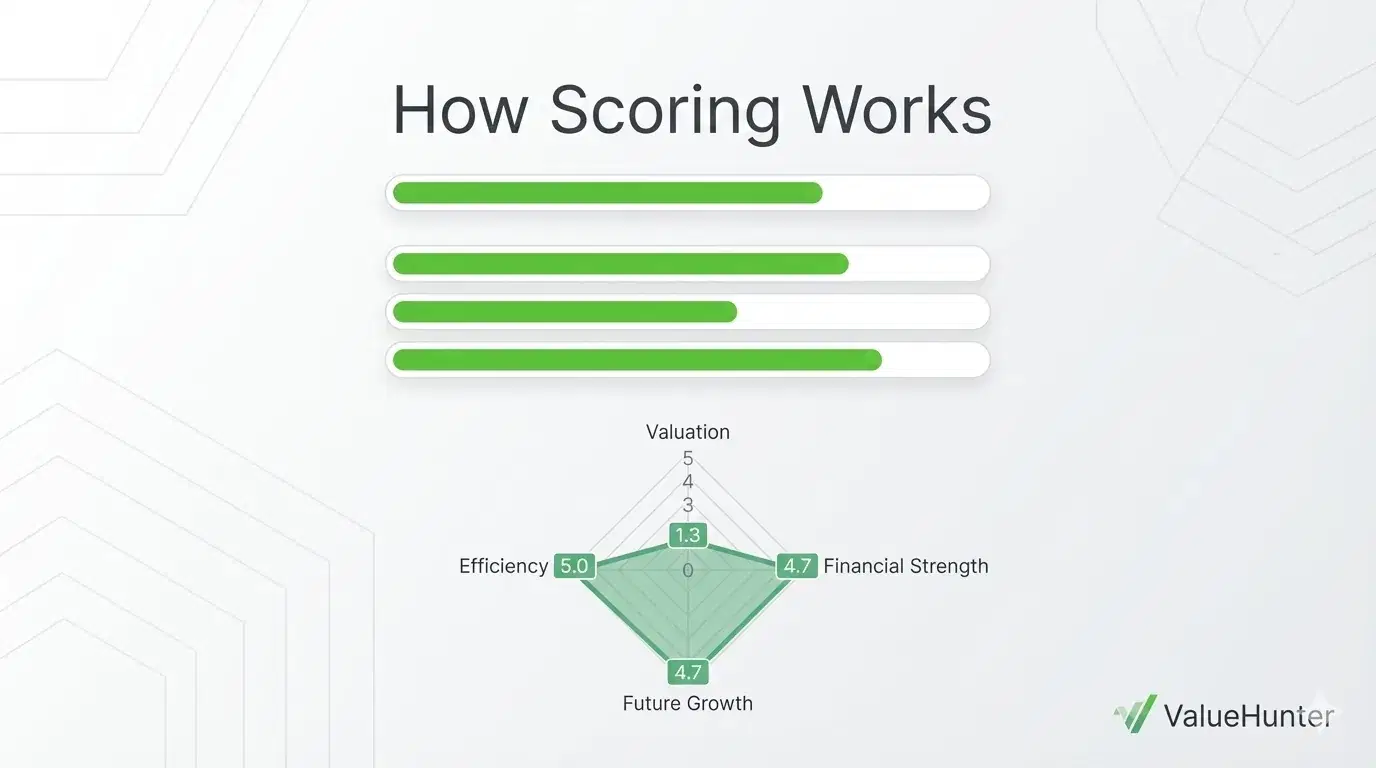
Consistency
Apart from the growth rates, the growth consistency is also considered. A company that has grown its revenue consistently by 10% per year for the past 5 years will get a higher score than a company that has grown its revenue by 10% per year, but with fluctuations.

In the image above is the growth scoring of AAPL. It grew its revenue all past 4 out of 5 years, and it will get a score of 75% (equivalent to 4) for revenue growth consistency.
Where to next?
View the top-scoring companies according to this algorithm here: top scored companies
Screen companies based on their scores here: screener
If you have any feedback, questions, or suggestions on this algorithm, we would love to hear them!
Drop me a line at contact@valuehunter.net